
The Stephan Curve Explained: What Happens to Your Teeth After You Eat
The Stephan curve, first described by Robert Stephan in 1943, is the most important dental science concept most people have never heard of. Within minutes of eating, oral bacteria drop plaque pH from 7.0 to near 5.0. Below pH 5.5, enamel demineralizes. Recovery takes 30 to 40 minutes of saliva buffering. Chewing sugar-free gum after meals significantly shortens this acid attack window by stimulating alkaline, high-bicarbonate saliva. This is the definitive explainer: primary sources cited, three SVG charts, and all the practical implications for daily habits.

Quick Answer
The Stephan curve, first described by Robert Stephan in 1943, shows what happens to the pH of dental plaque after you eat. Within a couple of minutes of sugar or fermentable carbohydrate exposure, oral bacteria ferment the food and produce lactic acid, dropping plaque pH from its resting value of around 7.0 to approximately pH 5.0. Below pH 5.5 (the critical pH), enamel begins to lose mineral. This demineralizing period lasts 20 to 40 minutes as saliva slowly buffers the acid back toward neutral. The window when pH is below 5.5 is when every acid attack on your teeth occurs. Repeated eating keeps pH below 5.5 for longer, preventing remineralization from occurring. Chewing sugar-free gum after meals significantly accelerates pH recovery by stimulating alkaline, high-buffering saliva, closing the acid window faster and shortening the period during which enamel loses mineral.
Last updated: June 2026 | Reviewed against Stephan 1943/1944 original research, modern caries biology literature, and clinical evidence on saliva and gum
The Stephan curve is the most important piece of dental science most people have never heard of. It explains, in a single graph, why cavities form, why grazing is worse than meals, why acidic drinks cause so much damage, and exactly when chewing gum does something useful. Understanding it changes how you think about everything you eat and drink.
Who Was Robert Stephan and What Did He Discover?
Robert M. Stephan was an American dental researcher working in the mid-twentieth century on the relationship between oral bacteria, acid, and tooth decay. In 1943, working with B.F. Miller, he published a foundational paper in the Journal of Dental Research (Stephan RM, Miller BF. "A quantitative method for evaluating physical and chemical agents which modify production of acids in bacterial plaques on human teeth." J Dent Res. 1943;22:45-51) that established a method for measuring pH changes in dental plaque. In 1944, he published the clinical application of this method: a graph showing the pattern of pH change in plaque immediately following exposure to a sucrose mouth rinse in human subjects.
What Stephan observed was not complicated, but its implications were profound. Before the rinse, plaque pH sat at its resting baseline of approximately 7.0. Within minutes of the sucrose rinse, pH dropped sharply below 5.5, the level at which enamel begins to demineralize. It then remained in this danger zone for an extended period before slowly recovering back toward neutral over the following 30 to 40 minutes.
This simple observation, that eating produces an acid attack on enamel that lasts far longer than the eating itself, became one of the most cited and reproduced findings in the history of dental research. The Oxford Reference defines the Stephan curve as "the curve on a graph, first described by Robert Stephan in 1943, showing the fall in pH below the critical level of pH 5.5, at which demineralization of enamel occurs following the intake of fermentable carbohydrates, acidic liquids, or sugar in the presence of acidogenic bacteria." After eighty years of replication, modification, and clinical application, the fundamental pattern Stephan described in 1943 remains the central model for understanding how cavities form.
The Three Phases of the Stephan Curve

The curve has three distinct phases, each reflecting a different biological process happening in the oral environment.
Phase 1: The Rapid Drop
Within minutes of fermentable carbohydrate or sugar entering the mouth, acidogenic bacteria in dental plaque begin metabolizing it through glycolysis. These bacteria, particularly Streptococcus mutans and lactobacilli, do not simply absorb nutrients the way most bacteria do. They convert sugars into lactic acid as a metabolic byproduct through their specific fermentation pathways. Lactic acid is a potent organic acid with a pH of around 2.4 in its pure form. Even in the diluted, buffered conditions of dental plaque, enough lactic acid accumulates within two to three minutes of sugar exposure to drop plaque pH from approximately 7.0 to near pH 5.0.
This initial drop is rapid because the bacteria are numerous, well-organized in biofilm, and have evolved to ferment carbohydrates efficiently. Plaque biofilm also acts as a partial physical barrier, trapping the acid against the tooth surface and slowing the diffusion of buffering ions from saliva into the plaque. The acid concentration at the enamel surface is higher than the ambient oral pH would suggest.
Phase 2: The Danger Zone
Below pH 5.5, hydroxyapatite (the mineral comprising approximately 96% of enamel by weight) becomes thermodynamically unstable in contact with the surrounding environment. The acid creates conditions in which the equilibrium between enamel mineral and the plaque fluid shifts toward dissolution: calcium and phosphate ions move out of the crystal lattice and into the plaque fluid, a process called demineralization. The enamel is not visibly damaged during this process. The early carious lesion of enamel is subsurface: most mineral loss occurs beneath a relatively intact surface layer. The tooth looks fine. But the internal structure is losing mineral with every minute that pH remains below 5.5.
This phase continues for as long as pH stays below the critical threshold. In Stephan's original experiment with a 10% sucrose rinse, this period lasted approximately 20 to 40 minutes. How long it lasts in any real eating situation depends on the nature of the food or drink consumed, the individual's salivary buffering capacity, the amount and type of food, and whether any pH recovery is interrupted by additional eating or drinking.
Phase 3: Gradual Recovery
As the initial fermentable substrate is consumed by bacteria or diluted and cleared by saliva, acid production begins to slow. Simultaneously, saliva continues to flow, delivering bicarbonate ions that react with the lactic acid and progressively raise pH back toward neutral. This recovery phase is gradual: as Pocket Dentistry summarizes the Stephan curve, within a couple of minutes of rinsing with a 10% sugar solution the plaque pH falls from about 7.0 to near pH 5.0, taking about 30 to 40 minutes to return to its baseline value.
Once pH rises above 5.5 again, demineralization stops. Once pH rises above approximately 5.5 with adequate calcium and phosphate in the saliva, remineralization begins: the saliva is now supersaturated with respect to hydroxyapatite, and calcium and phosphate ions can redeposit into the enamel crystal lattice, partially repairing the damage of the acid attack. Stimulated saliva, with a pH of approximately 7.8, is the ideal remineralizing environment. The repair is real but incomplete, which is why cumulative acid attacks over time eventually produce cavities even with adequate saliva function.
The Critical pH: Why 5.5 Is the Number That Matters
The critical pH of 5.5 is not an arbitrary threshold. It is the pH at which saliva and plaque fluid become thermodynamically unsaturated with respect to hydroxyapatite under typical in vivo conditions. Above pH 5.5, the plaque fluid contains enough calcium and phosphate ions, provided in part by saliva, that enamel mineral is in a stable or slightly supersaturated state: no net loss occurs, and early mineral losses may actually be repaired. Below pH 5.5, the equilibrium tips the other way, and hydroxyapatite dissolves.
The practical significance of this threshold is large. Everything above 5.5 is safe territory for enamel. Everything below 5.5 is the acid attack window. The total time teeth spend below pH 5.5 across a day is the primary determinant of whether the daily cycle of demineralization and remineralization resolves in favor of the enamel or against it. When acid attacks are brief and infrequent, remineralization wins and enamel remains intact. When acid attacks are long or frequent (or both), demineralization outpaces remineralization and caries initiates.
It is worth noting, as the Bowen 2013 "Stephan Curve Revisited" review in Odontology observed, that pH 5.5 is a generalization. The actual critical pH varies somewhat depending on the concentration of calcium and phosphate ions in the local plaque environment, the presence of fluoride (which forms fluorapatite, which demineralizes at a slightly lower pH), and whether cementum rather than enamel is the exposed surface (cementum begins to demineralize at pH 6.0 to 6.7, higher than enamel). The 5.5 threshold remains the most widely cited and clinically useful reference point.
Saliva's Role in pH Recovery

Understanding why pH recovery takes 30 to 40 minutes requires understanding what saliva is actually doing to neutralize the acid.
Saliva has three buffer systems: the carbonic acid/bicarbonate system (which plays the dominant role), the phosphate buffer system, and protein buffers. Of these, the bicarbonate system is the most important for post-meal pH recovery. Bicarbonate ions in saliva react with the hydrogen ions produced by bacterial acid fermentation in a classic acid-base buffering reaction, converting them to carbonic acid which then dissociates to water and carbon dioxide. This reaction progressively consumes the acid and raises pH.
The rate of this recovery depends on salivary flow. Resting (unstimulated) saliva flows at approximately 0.3 to 0.4 mL per minute with relatively low bicarbonate concentration. Stimulated saliva flows at 1.0 to 3.0 mL per minute with substantially higher bicarbonate concentration. The higher the salivary flow rate, the faster acid is buffered and cleared. This is why eating itself, which mechanically stimulates salivary flow through chewing and taste, somewhat accelerates recovery compared to simply having acid deposited on teeth without the mechanical stimulus of eating. It is also why anything that further increases stimulated salivary flow can shorten the acid attack window.
The resting salivary pH is approximately 6.2 to 7.6, with stimulated saliva reaching approximately 7.8. This elevated pH, combined with the high calcium and phosphate content of stimulated saliva, creates the supersaturated conditions needed for remineralization once pH has recovered above 5.5. Stimulated saliva is not just clearing acid. It is also delivering the mineral ions needed for enamel repair.
The Stephan Curve in Numbers
- Resting plaque pH: approximately 7.0
- pH after sugar exposure (2-3 minutes): approximately pH 5.0 (source: Pocket Dentistry, citing Stephan curve research; sugar intake can dramatically decrease salivary pH by almost 2.0 units, Acta Scientific Dental Sciences 2025)
- Critical pH threshold: 5.5 (below this, enamel demineralizes)
- Duration below 5.5: 20 to 40 minutes per acid challenge (Stephan 1944; Oxford Reference; PMC Cariology chapter)
- Recovery to baseline: 30 to 40 minutes after last acid exposure with adequate unstimulated saliva
- Stimulated saliva pH: approximately 7.8 (ideal for remineralization)
- Resting saliva flow: ~0.3-0.4 mL/min (limited buffering capacity)
- Stimulated saliva flow: ~1.0-3.0 mL/min (higher bicarbonate concentration, faster recovery)
What Changes the Shape of the Curve
The shape of the Stephan curve is not fixed. Several variables change how deep the pH drops, how long it stays below 5.5, and how quickly it recovers. Understanding these variables is where the curve becomes actionable.
Type of Carbohydrate
Different carbohydrates produce different Stephan curve profiles. Sucrose, glucose, and fructose are readily fermented by acidogenic bacteria and produce steep, deep pH drops. Cooked starch is also fermentable, but the curve is less steep because amylase must first break the starch down before bacteria can access it, introducing a delay. Sorbitol and xylitol are sugar alcohols that oral bacteria cannot ferment: they do not produce a Stephan curve at all. This is the mechanistic basis for why sugar-free sweeteners do not cause cavities and why xylitol specifically is protective. For a detailed explanation, see our article on sorbitol vs xylitol.
Physical Form of Food
Sticky foods that adhere to tooth surfaces remain in contact with plaque bacteria longer, providing a sustained substrate for acid production that extends Phase 2 of the curve. Liquid sugars are cleared more quickly by saliva. Dental care guidance from dentalcare.com notes that fibrous foods requiring chewing increase the rate of acid removal and reduce caries risk, partly because they mechanically stimulate salivary flow and partly because they do not adhere to surfaces as sticky refined foods do.
Salivary Flow Rate and Buffering Capacity
Individuals with high salivary flow rates and strong buffering capacity recover pH more quickly after acid challenges, spending less time below the critical pH per eating occasion. Those with reduced salivary flow (from medications, aging, systemic conditions, or dehydration) recover more slowly, extending the acid attack window for the same food or drink. For the full discussion of how reduced saliva elevates cavity risk, see our articles on medications that cause dry mouth and oral health after 60.
Plaque Load
Plaque provides both the bacteria that produce the acid and the physical matrix that traps acid against the tooth surface and slows saliva's buffering ions from diffusing in. More plaque means more acid production and slower clearance. The Bowen Stephan Curve Revisited paper noted that plaque acts as a partial barrier to diffusion of buffering ions, which is why plaque removal through brushing is foundational: it directly reduces the acid-producing mass and the diffusion barrier between enamel and saliva.
Why Frequency Matters More Than Amount
One of the most important practical implications of the Stephan curve is that the frequency of eating occasions matters more for cavity risk than the total amount of sugar consumed across a day. This is the conclusion that flows directly from the curve's structure.
Each eating occasion creates one acid attack: one Stephan curve event with a 20 to 40 minute danger zone and a subsequent recovery period. If three meals a day produce three acid attacks, the total time below pH 5.5 might be 60 to 90 minutes across the day, with full recovery between each meal. That leaves 22 to 23 hours at a safe pH, and remineralization occurs during that time.
If the same total food consumption is spread across 10 snacking occasions instead of 3 meals, the Stephan curve events overlap. Acid attack number 2 begins before the pH has fully recovered from attack number 1. The teeth spend 3 to 4 times as long below pH 5.5, while remineralization during that extended window cannot occur. As the Oxford Reference summary of the Stephan curve states: repeated intakes of fermentable carbohydrates cause the low pH to be maintained for longer periods, thereby not allowing remineralization to take place.
This is the mechanistic explanation for why the same quantity of sugar consumed as three meals with nothing between them produces dramatically less cavity formation than the same quantity consumed as continuous grazing throughout the day. The frequency of pH challenge, not the amount per challenge, determines cumulative enamel exposure time.
The Frequency Principle: Why Snacking Is More Damaging Than Meals
- 3 meals per day: 3 Stephan curve events. Approximately 60-90 minutes total below pH 5.5. Full pH recovery between meals allows remineralization.
- 10 snacking occasions: Overlapping Stephan curves. Teeth may remain below pH 5.5 for 4+ hours continuously. Remineralization cannot occur during extended low-pH windows.
- Continuous sipping (coffee, tea, sports drinks): One extended Stephan curve event lasting the duration of the drink, plus recovery time. Sipping a coffee over 2 hours can keep enamel below pH 5.5 for 2.5 to 3 hours in a single session.
- The practical rule: Consume acidic or fermentable food and drink at defined mealtimes. Between meals, drink only water. Allow full recovery before the next acid challenge.
Acidic Drinks and the Extrinsic Acid Version of the Curve
The Stephan curve was originally described for the bacterial acid pathway: bacteria fermenting sugars produce lactic acid that drops plaque pH. But the curve also applies to extrinsic acids from beverages, through a different primary mechanism.
When coffee (pH 4.5 to 5.5), tea (pH 4.9 to 5.5), sports drinks (pH 3.1 to 3.5), or wine (pH 3.3 to 3.5) contact the teeth, the acid in the drink directly lowers oral pH below 5.5 on contact, without requiring any bacterial fermentation step. The pH drops immediately rather than over 2 to 3 minutes. It also typically drops lower, because sports drinks and wine are far more acidic than the lactic acid produced by bacteria at typical in-vivo concentrations.
The recovery follows the same saliva-mediated buffering process as the bacterial acid version: saliva neutralizes the extrinsic acid and pH recovers over 20 to 40 minutes after the last sip. Continuous sipping of an acidic drink prevents this recovery entirely, maintaining teeth in a demineralizing environment for the duration of the drink plus a full recovery period afterward. For the specific mechanisms of how coffee, tea, and wine create staining alongside this pH damage, see our article on coffee, wine, and tea stains.
How Chewing Gum Changes the Curve

The Mars Wrigley Oralcare clinical overview summarizes the evidence directly: "chewing sugarfree gum for 20 minutes after meals and snacks can help patients to neutralize plaque acid. The saliva stimulated by chewing gum can help reverse the fall of pH caused by plaque bacteria following the consumption of sugars and starches."
The mechanism is salivary stimulation through mechanical and gustatory reflexes. Chewing activates both the masticatory reflex (mechanical stimulation from jaw movement) and the cephalic-phase response (sensory stimulation from the flavor of the gum). Together these produce stimulated saliva at 1.0 to 3.0 mL/min, with a pH of approximately 7.8 and high bicarbonate concentration. This elevated flow rate delivers alkaline buffering ions to the plaque significantly faster than resting saliva would, accelerating the Phase 3 recovery and shortening the time spent in the danger zone below pH 5.5.
The Beiswanger et al. clinical trial in the Journal of the American Dental Association (1998) provided direct clinical evidence: chewing sugar-free gum after meals produced a measurable reduction in clinical caries incidence compared to controls. The ADA Seal of Acceptance for sugar-free gum is specifically based on its demonstrated ability to increase salivary flow and neutralize plaque acid.
Manning and Edgar (Br Dent J, 1993) measured pH changes in plaque after meals and their modification by chewing gum, confirming that chewing sugar-free gum after eating meals significantly accelerated pH recovery compared to not chewing. Dawes and Macpherson (Caries Res, 1992) confirmed that chewing gums increased salivary flow rate and pH, with flow remaining elevated for up to two hours in some subjects.
A 2025 clinical study from Padova University confirmed the most recent evidence: both xylitol and maltitol sugar-free gums produced beneficial effects in reducing bacterial plaque and increasing salivary pH in pediatric patients, with effects appearing independent of the specific sweetener used, supporting the conclusion that the saliva-stimulation mechanism is the primary driver of pH recovery benefit.
For xylitol specifically, the gum adds a second mechanism beyond saliva stimulation: xylitol is not fermented by S. mutans or other acidogenic bacteria, meaning chewing xylitol gum produces no additional Stephan curve acid event of its own. Additionally, xylitol's metabolic disruption of S. mutans reduces the bacteria's acid-producing capacity over time, meaning the acid production in future Stephan curve events is progressively diminished with consistent use. The 2025 BMC Oral Health systematic review confirmed xylitol gum reduced S. mutans counts in 12 of 14 studies compared to sorbitol.
Nano-hydroxyapatite in functional gum addresses the other side of the equation: not just accelerating pH recovery (reducing Phase 2 duration) but actively delivering remineralization mineral during Phase 3 (the recovery window). When the gum is chewed during and after Phase 3, the nano-HAp particles provide direct mineral input to a tooth surface that is ready to remineralize, supplementing what saliva's calcium and phosphate ions alone would deliver. For the full mechanism, see our article on what nano-hydroxyapatite is and why it works.
What the Stephan Curve Means for Daily Habits
The Stephan curve translates into a small number of high-leverage practical habits that directly reduce the time teeth spend in the danger zone below pH 5.5.
Eat at defined mealtimes rather than grazing. Three meals with defined endpoints produce three Stephan curve events per day. Continuous snacking and sipping produces overlapping events that merge into extended low-pH periods. Between meals, drink water only. Water dilutes any residual acid but does not create a fermentable substrate for bacteria.
Avoid sipping acidic drinks slowly. Every sip resets the acid attack clock. Finishing a coffee in ten minutes creates one recovery window. Sipping the same coffee over two hours creates a two-and-a-half hour window of acid exposure before recovery even begins.
Do not brush immediately after eating or drinking acidic substances. Enamel is softened during Phase 2 of the Stephan curve. Brushing on softened enamel removes mineral through abrasion. Wait until pH has recovered above 5.5, approximately 30 minutes, before introducing toothbrush abrasion.

Chew sugar-free gum for 10 to 20 minutes after meals and after acidic drinks. The saliva stimulation accelerates Phase 3 recovery, shortening time below pH 5.5. Xylitol gum adds the benefit of directly suppressing the acid-producing bacteria responsible for Phase 1 and 2 of the curve. Nano-HAp adds mineral delivery during Phase 3 when the remineralization window is open. The ADA endorses chewing sugar-free gum after meals for exactly this mechanism. For the clinical case for why this timing matters, see our article on when to chew remineralizing gum.
The Stephan Curve Applied: Daily Habits That Reduce Acid Attack Time
- Eat at defined mealtimes: 3 curve events per day with full recovery between each. Grazing creates overlapping events with no recovery window.
- Drink water between meals: No fermentable substrate, no curve. Water also dilutes and clears residual acid.
- Finish drinks quickly rather than sipping: One curve event per drink session vs. an extended event for the full sipping duration.
- Wait 30 minutes before brushing after acid exposure: Brushing during Phase 2 (below 5.5) removes softened enamel mineral. Wait for recovery first.
- Chew sugar-free gum immediately after eating or acidic drinks: Stimulates saliva that accelerates Phase 3 recovery. Xylitol reduces bacterial acid production capacity. Nano-HAp delivers mineral during the remineralization window. ADA-endorsed for 20 minutes post-meal.
Frequently Asked Questions
What is the Stephan curve?
The Stephan curve is a graph first described by Robert Stephan in 1943 showing the change in dental plaque pH over time after exposure to fermentable carbohydrates or sugar. It has three phases: a rapid pH drop as oral bacteria ferment sugars and produce lactic acid; a sustained period below pH 5.5 (the critical threshold at which enamel demineralizes) lasting 20 to 40 minutes; and a gradual recovery back toward neutral pH as saliva buffers the acid. Within a couple of minutes of sugar exposure, plaque pH drops from approximately 7.0 to near 5.0. It takes 30 to 40 minutes to return to baseline. Every acid attack on tooth enamel occurs during the time spent below pH 5.5 on the Stephan curve.
Why is pH 5.5 the critical threshold?
pH 5.5 is approximately the pH at which saliva and plaque fluid become unsaturated with respect to hydroxyapatite, the mineral that enamel is made of. Above pH 5.5, enamel mineral is stable or is actively being repaired (remineralized) by calcium and phosphate ions in saliva. Below pH 5.5, the equilibrium shifts and enamel mineral dissolves. Every minute teeth spend below pH 5.5 represents active mineral loss. Every minute above pH 5.5 with adequate saliva represents either stability or active repair. The balance between these periods determines whether cavities form over time.
Why does frequent snacking cause more cavities than eating the same food at meals?
Each eating occasion creates one Stephan curve event: a 20 to 40 minute period below pH 5.5 followed by recovery. Three meals create three events with full recovery between them. Ten snacking occasions can create overlapping events where recovery from one acid attack is interrupted by the next. As the Oxford Reference states: repeated intakes of fermentable carbohydrates cause the low pH to be maintained for longer periods, thereby not allowing remineralization to take place. The cumulative time below pH 5.5, not the total amount of sugar consumed, is the primary driver of cavity formation.
Does chewing gum after meals actually speed up pH recovery?
Yes, with direct evidence. Chewing stimulates salivary flow through mechanical and gustatory reflexes, producing stimulated saliva at 1.0 to 3.0 mL/min (versus resting saliva at 0.3 to 0.4 mL/min) with elevated bicarbonate content. This alkaline, high-buffering saliva neutralizes plaque acid faster than resting saliva alone, shortening the time teeth spend below pH 5.5. Manning and Edgar (Br Dent J, 1993) confirmed that chewing sugar-free gum after eating significantly accelerated pH recovery. Beiswanger et al. (JADA, 1998) found a measurable reduction in clinical caries incidence in patients who chewed sugar-free gum after meals. The ADA endorses chewing sugar-free gum for 20 minutes after meals specifically for this acid-neutralization effect.
What happens if you brush teeth during the Stephan curve?
Brushing during Phase 2 of the Stephan curve, when pH is below 5.5 and enamel is softened, mechanically removes mineral from an already acid-vulnerable surface. Enamel in its softened state is more susceptible to abrasive wear than fully mineralized enamel. Standard dental guidance recommends waiting at least 30 minutes after eating or drinking acidic substances before brushing, allowing saliva time to buffer pH back above 5.5 and begin enamel rehardening. Chewing gum in this interval actively accelerates the rehardening process.
Do acidic drinks cause the same Stephan curve as sugary foods?
They produce a similar pattern but through a different primary mechanism. Sugary foods cause pH to drop through bacterial fermentation (takes 2 to 3 minutes). Acidic drinks (coffee pH 4.5-5.5, sports drinks pH 3.1-3.5, wine pH 3.3-3.5) drop oral pH immediately on contact because the acid is extrinsic rather than bacterially produced. The acidic drink curve can be deeper (sports drinks go far below 5.5 immediately) and may last longer if sipping continues. Recovery follows the same saliva-mediated buffering process. Continuous sipping of acidic drinks prevents recovery entirely, creating an extended demineralizing environment that compounds both acid erosion and staining risk.
Bottom Line
Robert Stephan described the mechanism behind cavity formation eighty years ago, and the model remains accurate today. Every acid attack on your teeth follows the same three-phase curve: rapid pH drop below 5.5, a 20 to 40 minute danger zone where enamel loses mineral, and gradual recovery as saliva buffers the acid back toward neutral. The total time your teeth spend below pH 5.5 across a day determines whether remineralization can keep up with demineralization. Eating at defined mealtimes, drinking only water between meals, avoiding slow sipping of acidic drinks, and chewing sugar-free gum for 20 minutes after eating are the habits that reduce that exposure time most effectively.
Chewing gum works in this context because it is the most practical available stimulus for the salivary flow that actually shortens the curve. Xylitol reduces the bacteria that drive Phase 1. Nano-HAp delivers mineral during Phase 3 when the remineralization window opens. The entire case for post-meal remineralizing gum is built on this one eighty-year-old curve that dental researchers have been reconfirming ever since.
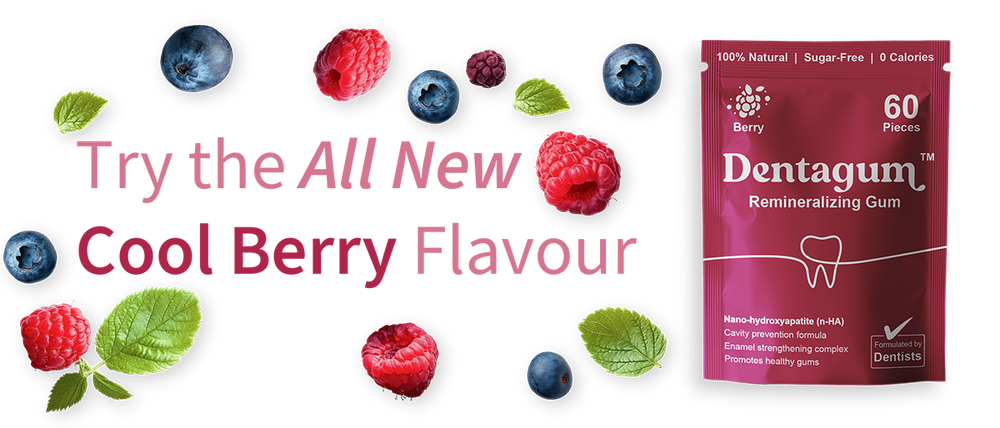
Try Dentagum: Chew After Every Meal, Every TimeResearch Summary
This article draws on Stephan's original research, modern caries biology, and clinical evidence on salivary pH and gum. Primary sources include: Stephan RM, Miller BF. "A quantitative method for evaluating physical and chemical agents which modify production of acids in bacterial plaques on human teeth." J Dent Res. 1943;22:45-51 (original methodology); Stephan RM 1944 (clinical sucrose rinse trial and original curve graph); Oxford Reference definition of Stephan curve (confirmed as 1943 publication, citation Stephan RM, Miller BF); Pocket Dentistry cariology chapter (pH drops from 7.0 to near 5.0 within minutes; 30-40 min return to baseline); Bowen WH. "The Stephan Curve revisited." Odontology. 2013;101(1):2-8 (critical pH nuance; plaque as diffusion barrier; multiple pH values within plaque matrix); PMC Stephan curve WSL orthodontics pilot study 2023 (three phases confirmed: rapid drop; demineralization below 5.5; 30-60 min recovery); Manning RH, Edgar WM. pH changes in plaque after eating snacks and meals, and their modification by chewing gum. Br Dent J 1993;174:241-244; Beiswanger BB et al. The effect of chewing sugar-free gum after meals on clinical caries incidence. J Am Dent Assoc. 1998;129:1623-6; Dawes C, Macpherson LM. Effects of nine different chewing-gums and lozenges on salivary flow rate and pH. Caries Res. 1992;26:176-82; ADA Chewing Gum page (ada.org); Ludovichetti FS et al. Effect of Xylitol and Maltitol Chewing Gums on Plaque Reduction and Salivary pH Modulation. Dentistry Journal. 2025;13(6):233. Söderling E et al. BMC Oral Health 2025 (xylitol vs S. mutans, 12 of 14 studies); Mars Wrigley Oralcare clinical overview (neutralizing plaque acids, 20 min post-meal). All Dentagum ingredient statistics from ingredient-level published research; not Dentagum product trial claims.
References
- Stephan RM, Miller BF. A quantitative method for evaluating physical and chemical agents which modify production of acids in bacterial plaques on human teeth. J Dent Res. 1943;22:45-51. [Original Stephan curve methodology paper; basis for all subsequent curve research]
- Stephan RM. Intra-oral hydrogen-ion concentrations associated with dental caries activity. J Dent Res. 1944;23:257-266. [Clinical sucrose mouth rinse trial; original Stephan curve graph showing pH drop and recovery kinetics]
- Oxford Reference. "Stephan curve." In: A Dictionary of Dentistry. [Defined as: "the curve on a graph, first described by Robert Stephan in 1943, showing the fall in pH below the critical level of pH 5.5... After consumption there is elimination of the acid and a return to normal saliva or plaque pH"]
- Pocket Dentistry. Chapter 15: Cariology. [Within a couple of minutes of 10% sugar solution rinse, plaque pH falls from ~7.0 to near pH 5.0; takes 30-40 min to return to baseline; below pH 5.5 demineralisation of enamel occurs]
- Bowen WH. The Stephan Curve revisited. Odontology. 2013;101(1):2-8. PubMed 23224410. [Critical discussion: critical pH not absolute; multiple pH values within plaque matrix; alkali production in plaque receives insufficient attention; plaque as diffusion barrier]
- Stephan curve. PMC10127078. Pilot study in orthodontic patients. 2023. [Three phases of Stephan curve confirmed: rapid drop; demineralization below 5.5; 30-60 min recovery; pH 5.5 as critical threshold for caries formation]
- Manning RH, Edgar WM. pH changes in plaque after eating snacks and meals, and their modification by chewing sugared- or sugar-free gum. Br Dent J. 1993;174:241-244. [Sugar-free gum after eating significantly accelerated pH recovery vs. no gum]
- Dawes C, Macpherson LM. Effects of nine different chewing-gums and lozenges on salivary flow rate and pH. Caries Res. 1992;26:176-82. [Chewing gums increased salivary flow rate and pH; flow elevated for up to two hours in some subjects]
- Beiswanger BB, Boneta AE, Mau MS et al. The effect of chewing sugar-free gum after meals on clinical caries incidence. J Am Dent Assoc. 1998;129:1623-6. [Clinical trial: measurable reduction in caries incidence in patients who chewed sugar-free gum after meals]
- ADA. Chewing Gum. ada.org. [Endorsement of sugar-free gum after meals for saliva stimulation and acid neutralization; basis for ADA Seal of Acceptance]
- Mars Wrigley Oralcare. Neutralizing Plaque Acids. wrigleyoralcare.com. [Clinical overview: chewing sugar-free gum for 20 minutes after meals and snacks can help neutralize plaque acid; summarizes Beiswanger, Dawes, Manning evidence]
- Ludovichetti FS, Stellini E, Rodella C et al. Effect of Xylitol and Maltitol Chewing Gums on Plaque Reduction and Salivary pH Modulation: A Retrospective Study in Pediatric Patients. Dentistry Journal. 2025;13(6):233. DOI: 10.3390/dj13060233. PMC12199195. [Both xylitol and maltitol gums reduced plaque and increased salivary pH; effects independent of sweetener type; saliva-stimulation mechanism primary driver]
- Söderling E, Pienihäkkinen K. Specific effects of xylitol chewing gum on mutans streptococci levels, plaque accumulation and caries occurrence. BMC Oral Health. 2025. [Xylitol reduced S. mutans in 12 of 14 studies vs. sorbitol; xylitol is not fermented by cariogenic bacteria]
- Galvan J, Andrade C. Salivary pH Recovery: Analyzing the Buffering Capacity of Saliva After Consuming Basic, Neutral, and Acidic Drinks. Acta Scientific Dental Sciences. 2025;9(11):26-32. [Sugar intake decreased salivary pH by ~2.0 units; saliva supersaturated above 5.5 for remineralization; unsaturated below 5.5]
